COMPARATIVE STUDY ON VENOUS AND CAPILLARY BLOOD COLLECTION FOR ESTIMATION OF GLUCOSE

SALT Journal of Scientific Research in Healthcare
Volume 1, Issue 2, Page 13-23, Published on 28th September 2021

https://doi.org/10.56735/saltjsrh.ms2101021323
Research Article
GEETHA PRIYA1, VISHAKHA K1, POOJA S1 AND *VYSHNAV MANIKANDAN2
1Department of Medical Lab Technology, Loyola College (Autonomous), Chennai 600032, India
2Masters in Human Clinical Embryology and Assisted Conception, School of Medicine, University of Dundee, Nethergate, Dundee DD1 4HN, Scotland, UK.
*Corresponding Author: Vyshnav Manikandan, Masters in Human Clinical Embryology and Assisted Conception, School of Medicine, University of Dundee, Nethergate, Dundee DD1 4HN, Scotland, UK.
ORCID ID: 0000-0002-4061-2840
Email: 2472888@dundee.ac.uk
ABSTRACT
Diabetes is a chronic condition caused by a malfunction of the pancreas to secrete enough insulin resulting in two conditions: hyperglycemia and hypoglycemia. Glucometer is used for home blood glucose monitoring (HBGM). In the present study, out of 100 patients, the difference between venous and capillary blood glucose difference is very little i.e, 2.48 g/dl by using a glucometer. The study supports the view that venous blood glucose measurements can also be used as a substitute for capillary derived specimens in the management of non-critically ill patients. Sometimes, healthcare providers shall be cautious of pseudo-hypo/hyperglycemia where the capillary blood glucose does not correlate with venous plasma glucose. Evidence-based treatment decisions shall help diabetes management in such a scenario.
Keywords: Glucose, capillary, venous, blood collection
1.0 INTRODUCTION
The presence of glucose in the urine was first used to diagnose diabetes; about 2,500 years ago, it was discovered that ants were drawn to the urine of some people. Before chemical procedures for detecting sugars in urine became accessible in the 18th and 19th centuries, the sweet taste of urine was employed for diagnosis. Over a century ago, blood tests to assess glucose in the blood were established, and hyperglycemia became the primary criterion for diagnosing diabetes. Initial diagnostic criteria relied on the response to an oral glucose challenge, while later measurement of blood glucose in an individual who was fasting also became acceptable (ADA, 2007).
Diabetes is a long-term condition in which the pancreas fails to produce enough insulin or the body’s insulin is ineffectively utilised. Hyperglycemia and other related disturbances in the body’s metabolism can lead to serious damage to many of the body’s systems, especially the nerves and blood vessels (WHO, 2004).
Diabetes is a life-threatening condition, and it is a worldwide, 3.2 million deaths are attributable to diabetes every year. Diabetes is responsible for one out of every 20 deaths; 8,700 deaths each day; and six deaths per minute. Diabetes is responsible for at least one out of every ten fatalities in adults aged 35 to 64. Three-quarters of the deaths among people with diabetes aged less than 35 years are due to their condition.
Diabetes is a widespread ailment that is increasing in prevalence around the world. Diabetes affects at least 171 million individuals globally. In developing countries, the number of people with diabetes will increase by 150% in the next 25 years. Diabetes will rise globally due to population ageing and expansion, as well as rising trends toward obesity, bad diets, and sedentary lifestyles. In developed countries, most people with diabetes are above the age of retirement, whereas in developing countries, those most frequently affected are aged between 35 and 65 (WHO, 2003).
India accounts for the largest number of people 50.8 million suffering from diabetes in the world, followed by China (43.2 million) and the United States (26.8 million), revealing new figures released by the International Diabetes Federation (IDF). India continues to be the “diabetes capital” of the world, and by 2030, nearly 9 per cent of the country’s population is likely to be affected by the disease, warns the fourth edition of World Diabetes Atlas launched by the IDF at the 20th World Diabetes Congress in Montreal, Canada.
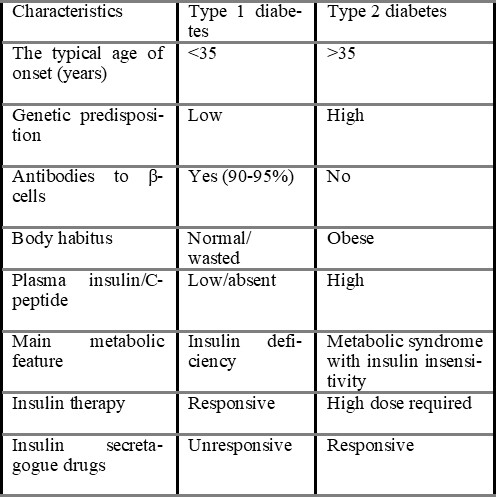
Diabetes mellitus is a group of metabolic disorders of carbohydrate metabolism in which glucose is underutilised and overproduced, causing hyperglycemia. The disease is classified into several categories (ADA, 2007). Type 1 diabetes mellitus, formerly known as insulin-dependent diabetes mellitus (IDDM) or juvenile-onset diabetes mellitus, is usually caused by autoimmune destruction of the pancreatic islet b-cells, rendering the pancreas unable to synthesise and secrete insulin (Castro, 2005). Type 2 diabetes mellitus, formerly known as non-IDDM or adult-onset diabetes, is caused by a combination of insulin resistance and inadequate insulin secretion (Sacks & McDonald, 1998).
Gestational diabetes mellitus (GDM), which mimics type 2 diabetes more than type 1, occurs in around 7% (range, 5% – 15%) of pregnancies that normally resolves after delivery. Other types of diabetes are rare. Type 2 is the most common form, accounting for 85%-95% of diabetes in developed countries. Some patients cannot be clearly classified as type 1 or type 2 diabetes (Balasubramanyam et al., 2006).
1.2TYPES OF DIABETES MELLITUS
1.2.1 Type 1 Diabetes mellitus (Insulin-dependent Diabetes mellitus, IDDM): People with this type of diabetes produce very little or no insulin. It constitutes about 10% of cases of diabetes mellitus. It was previously termed Juvenile-onset diabetes (JOD) due to its occurrence at a younger age; this patient has an absolute requirement for insulin replacement as treatment. Type-1 diabetes mellitus is further subdivided into two types.
Subtype 1A (immune-mediated) diabetes mellitus: It is characterised by autoimmune destruction of b-cells which usually leads to insulin deficiency. Immune-mediated diabetes commonly occurs in childhood and adolescence, but it occurs at any age, even in the eighth and ninth decades of life. Autoimmune destruction of b-cells has multiple genetic predispositions and is also related to environmental factors that are still defined. Although patients are rarely obese when they present with this type of diabetes, obesity is not incompatible with the diagnosis. These patients are also prone to other autoimmune disorders such as Grave’s disease, Hashimoto’s thyroiditis, Addison’s disease, vitiligo, celiac sprue, autoimmune hepatitis, myasthenia gravis, and pernicious anaemia.
Type 1B (idiopathic) diabetes mellitus: It is characterised by insulin deficiency with a tendency to develop ketosis, but these patients are negative for autoimmune markers. Some of these people remain insulinogenic all of their lives and are prone to ketoacidosis, but they show no signs of autoimmunity. Although only a minority of patients with type 1 diabetes fall into this category, diabetes suffers from episodic ketoacidosis and exhibit varying degrees of insulin deficiency between episodes. An absolute requirement for insulin replacement therapy in affected patients may come and go (ADA, 2010).
Though type 1 diabetes mellitus occurs commonly in patients under 30 years of age, autoimmune destruction of β-cells can occur at any age. In fact, 5-10% of patients who developed diabetes mellitus above 30 years of age are type 1A diabetes mellitus, and hence the term Juvenile onset diabetes has become obsolete (Mohan, 2006).
Type 1 diabetics require daily insulin injections to stay alive. Excessive thirst, persistent hunger, excessive urine, weight loss for no apparent cause, quick hard breathing, visual abnormalities, tiredness, or exhaustion are all common symptoms of type 1 diabetes. These symptoms may occur suddenly (David et al., 2011).
1.2.2 Type 2 Diabetes mellitus (Non-insulin-dependent diabetes mellitus, NIDDM): This kind of diabetes prevents people from successfully using insulin. This type comprises about 80% of cases of diabetes mellitus. It was previously called maturity diabetes (MOD). Although type 2 diabetes mellitus predominantly affects older individuals of ages above 30 years, it also occurs in obese adolescent children; hence the term MOD for it is inappropriate. Moreover, many type 2 diabetes mellitus patients also require insulin therapy to control hyperglycemia or to prevent ketosis and thus are not truly non-insulin-dependent contrary to its former nomenclature (Mohan, 2006).
Diabetes mellitus type 2 (DM2) is a highly prevalent disease that is expected to become epidemic in the coming years in both developed and developing countries, posing a significant public health problem due to the disease’s high morbidity and mortality, as well as the high costs associated with its control and treatment of its complications. DM2 is among the ten major causes of death in several industrialised and emergent countries (Foss & Andrade et al., 2010).
1.3 GLUCOMETER
Glucose meters are widely used in hospitals, outpatient clinics, ambulatory medical care (ambulances, helicopters, cruise ships), and home self-monitoring. The history of glucose meters started in 1963 when Ernie Adams invented the Dextrostix®, a paper strip that develops a blue colour whose intensity was proportional to glucose Concentration and could be read by reading by visually comparing the strip colour to a colour-concentration chart. This method gave an approximation of blood glucose levels. In 1970, Anton H. Clemens developed the first blood glucose meter and glucose self-monitoring system, the Ames Reflectance Meter (ARM), to detect reflected light from a Dextrostix (Mendosa, 2000).
Glucose metres are now used for a variety of purposes in medicine, including diagnosing hypoglycemia and hyperglycemia in the emergency room and physician’s office, as well as managing tight glycemic control in intensive care units and SMBG at home. Apart from diabetes, hyperglycemia can be caused by stress, such as trauma, stroke, and other acute diseases that often necessitate intense care. Hyperglycemia can also be caused by the use of certain drugs, such as steroids. Hypoglycemia, on the other hand, can be brought on by a variety of acute and chronic illnesses (Tonyouskina, 2009).
Hypoglycemia can be the result of hyperinsulinism, lack of counter-regulatory hormones (cortisol or growth hormone), inborn errors of metabolism, and alcohol and medication intoxications (sulfonylurea, salicylates, propranolol). Ketotic hypoglycemia, a common condition in paediatrics, may require parents to use a glucose meter to avoid hypoglycemia and establish a safe feeding schedule. Hypoglycaemia is especially common in small children because of the large size of their brains in proportion to the rest of their bodies. The brain accounts for 60% of glucose utilisation, so infants and small children have higher glucose utilisation rates and are more prone to hypoglycemia (History et al., 2009).
Hyperglycemia must be recognised and treated quickly, as it can cause dehydration, metabolic abnormalities, and long-term cardiovascular consequences if left untreated. The American diabetes association (ADA) recommends SMBG for diabetes patients as a key component of their disease management program (ADA, 2009). Glycemic control is also increasingly being recognised as a priority in the treatment of critically ill patients. Van den Berghe et al., demonstrated a significant reduction in mortality through normalisation of glucose levels in patients whose medical intensive care unit stay was >72 h and reduced morbidity in all other intensive care unit patients, regardless of the duration of their stay (Van den Berghe et al., 2006). Improved glycemic management has been linked to better clinical outcomes in other trials conducted in a range of inpatient settings. Increasing evidence for the value of tight glycemic control in the management of inpatients with diabetes has led to the ADA target range of 110-114 mg/dl (6.11-10.0 mmol/litre) for critically ill patients and the American Association of Clinical Endocrinologists recommendation of 110 mg/dl (6.11 mmol/litre) as the upper cutoff concentration for glucose in critically ill patients (ADA, 2006).
Glucose meters are utilised by a diverse population of patients, representing all ages and the acuteness of medical conditions.
The reliability of results can be affected by environmental effects. Operators may inadvertently influence meter results. These preanalytic variables should be taken into consideration when interpreting blood glucose results (Bergenstal, 2008).
1.3.1 Principles of glucose detection
An enzymatic reaction and a detector are the two most important components of glucose metres. The enzyme portion of the glucose meter is generally packed in a dehydrated state in a disposable strip or reaction cuvette. The glucose in the patient’s blood sample rehydrates and combines with the enzymes to create a detectable result. Some meters generate hydrogen peroxide or an intermediary that can react with a dye, resulting in a colour change proportional to the concentration of glucose in the solution. Other metres include the enzymes into a biosensor, which produces an electron that the metre detects. There are three principle enzymatic reactions utilised by current glucose meters: glucose oxidase, glucose dehydrogenase, and hexokinase. Each enzyme has its own set of benefits and drawbacks.
Because enzymes are proteins that can denature and become inactive at severe temperatures, all metres are subject to heat and cold. Although packaged in a dry state, exposure of the enzyme to humidity can prematurely rehydrate the proteins and limit their reactivity when utilised for patient testing. As a result, the disposable reagents for glucose metres must be protected from temperature and humidity extremes. Such conditions could occur when transporting the reagents outside in the heat of summer or the cold of winter. Test strips should not be stored in closed vehicles for extended periods and be protected from rain, snow, and other environmental elements. The detector portion of the meter is composed of electronics, so it must be protected from extremes of temperature, humidity, moisture, and elements. Many metres now incorporate internal temperature checks that stop patient results or display an error code if the ambient temperature and humidity are outside of the manufacturer’s specifications. Glucose metres, like any electrical gadget, should not be submerged in water when cleaning and must be protected from moisture.
Glucose metres are widely used in a range of health care settings to control hypoglycemia and hyperglycemic conditions. However, determining the accuracy of glucose metres is difficult. Glucose metres can only detect glucose in whole blood, which is unstable. The degree of agreement between a test result and the true value of an analyte is referred to as technical accuracy. Truth for glucose is an analysis by isotope dilution mass spectrometry, and frozen serum standards analysed by this method are available from the National Institute of Standards and Technology. Truth for whole blood has not been established, and cell must be separated from the whole blood matrix before analysis by a method like an isotope dilution mass spectrometry. Glucose metres cannot analyse serum, and isotope dilution mass spectrometry, which can be used to assess glucose metre accuracy, is not widely available in most hospitals and diabetic clinics.
Consensus standards recommended comparing whole blood analysis on a glucose meter against plasma/serum centrifuged from a capillary specimen and analysed by a clinical laboratory comparative method.
When the differences between venous and capillary blood are addressed, capillary samples may not give enough volume to test by both methods, and venous samples may be utilised as an alternative.
There are thus multiple complexities involved in defining technical accuracy and no clear consensus among standard agencies and professional societies on accuracy criteria. Clinicians, however, are more concerned
with the clinical agreement of the glucose meter with a serum/plasma laboratory result. Acceptable criteria for clinical agreement vary across the range of glucose concentration and depend on how the result will be used in the screening or management of the patient.
Operator technique, environmental exposure, and patient conditions such as medication, oxygen therapy, anaemia, hypotension, and other illness states can all alter glucose metre results (Ksenia et al., 2009).
1.4 Glucose Concentration Difference between Arterial, Capillary, Venous Blood
Three of the major factors that influence glucose test results are the type of chemical analysis used for the test, the type of sample analysed (whole blood versus plasma), and the source of the blood (venous or arterial) (Eriksson et al., 1983).
Home glucose monitoring has historically depended on a drop of capillary blood from the finger, however issues have arisen about the comparability of off-finger capillary locations.
Until recently, capillary blood from fingersticks was the standard sample used in home glucose monitoring.
A blood sample from the earlobe or heel was occasionally used (infant monitoring). Capillary samples taken from the finger or ear lobe have been found to be closely related to arterial blood values, meaning that their glucose and oxygen characteristics are more venous blood values are similar to arterial blood values. Even using fingerstick blood; however, questions have been raised concerning differences in finger sampling technique and variations in peripheral blood flow, both of which could affect the composition of capillary blood.
The main worry that has been expressed is the contamination of test samples, i.e., too much squeezing or ‘milking’ of the fingertip to produce a drop of blood may cause inaccuracies from either excess tissue fluid or haemolysis (Rasaiah and Somogyi, 1985).
Capillary blood samples from places other than the fingertips (forearm, upper arm, palm of hand, calf, or thigh) are utilised to quantify glucose in the latest self-monitoring of blood glucose (SMBG) devices. These many sites must handle the finger’s blood variation issues as well as the spatial and temporal complexity of local cutaneous blood flow. Capillary blood samples from the forearm are said to be more similar to venous blood values than arterial blood samples. Specifically, a TheraSencTM FreeStyleTM test strip package insert states:
“The disparity is comparable to the differential between capillary finger measures and venous measurements that are commonly observed. The results of a venous whole blood sample are around 7% lower than those of a capillary sample taken from the same person with normal glucose levels.” However, an empirical conversion factor between forearm capillary and venous blood glucose levels has neither been supported nor disproved in literature (Lopez et al., 2013).
Deborah et al., 2001, compared capillary and venous blood glucose measurement in healthy volunteers by using a glucometer; a whole blood was used for both capillary and venous blood. The study reveals that Out-of-hospital (OOH) emergency personnel measure serum glucose in order to determine the need for dextrose therapy. Most devices that measure serum glucose are designed to use capillary blood obtained from finger puncture. However, venous blood collected after the administration of an intravenous line (IV) is frequently used by OOH emergency workers to test serum glucose. The study shows that capillary and venous blood glucose has a less significant difference in healthy volunteers.
2.0 REVIEW OF LITERATURE
When blood glucose values from capillary or venous sources are analysed on a bedside glucometer, there are slight but substantial discrepancies.
Although there is a high degree of correlation between venous and capillary generated samples, caution should be applied when taking the results as similar or substituting either for a laboratory blood glucose result (Boyd et al., 2003).
Measurements based on capillary blood had a very large variability composed of other methods. Measurements based on whole venous blood tended to give results 0.5 mmol/L lower than other methods. Bendix et al., 2007 data indicates that the current diagnostic cutoff points, as recommended by WHO for non-plasma specimens, are not fully compatible and may differ as much as 0.5 mmol/L between specimens.
Kyung et al., 2010 have compared Blood Glucose Measurements using samples obtained from the Forearm, Finger Skin Puncture, and Venous Serum with a portable glucometer in 555 subjects, including 61 diabetic patients, under fasting conditions. The result shows that the forearm shows an excellent linear relationship with finger and venous serum and was highly consistent with the standard BGT, thereby confirming its applicability in self-testing in fasting conditions as a clinical procedure.
Simultaneous measurements of venous plasma and capillary blood glucose were performed on random samples in 609 people, fasting samples in 685 people, and 2 hours after oral glucose samples in 463 people. Separate capillary and venous samples were collected each time by Colagiuri et al., 2003; the findings highlight the difficulty of equating glucose levels from one sample and measuring process to another, as well as raise questions about current published equivalence values, which could lead to glucose tolerance status misclassifications.
The relationship between glucose levels in dermal interstitial fluid (ISF), and capillary and venous blood was studied with the dermal ISF samples obtained using the suction blister technique. The experiment was carried out on diabetics who were closely monitored and whose blood glucose levels were modified to cause rapid variations in blood glucose levels.
When individual patients were analysed separately, and when data from all subjects were merged, glucose levels in the three compartments showed high correlations. No significant time lag during glucose excursions was observed among the ISF and capillary and venous glucose levels Suresh et al., 2001.
Capillary and venous circulation under steady-state conditions, blood glucose levels are similar, but under dynamic conditions, they may differ. Variability associated with these differences was substantial in all states. As hospital insulin infusion methods become more extensively used, healthcare professionals, should be aware that glucose levels obtained from capillary and venous sites may differ. Based on the tight ranges used in these protocols, these differences may impact insulin dosing decisions Kirsten et al., 2001.
Alison et al., 2006 have found out that venous blood sampling produces similar results to capillary blood sampling for measuring blood glucose response to foods. The study attempted to reduce the intra-individual variability in CGE measurements. The variability in CGE readings was not significantly reduced by measuring an individual’s blood glucose levels more frequently over two hours or by ingesting the test on the same day, eating and drinking the reference drink.
Twelve healthy volunteers were instructed to ingest a 50g glucose solution for two hours and examine correlations and differences on two types of blood samplings, venous blood sampling and finger-prick blood sampling. According to Chiaohsin et al., 2012 there is no significant differences between the fasting venous blood glucose value (87.4±0.4mg/dL) and the fasting capillary blood glucose(91.6±4.4mg/dL) (0min); there are significant differences between the postprandial venous blood glucose concentration and the postprandial capillary blood glucose concentration, both of which reach the maximum levels at 30 min (postprandial venous blood glucose value=122.0±1.2 mg/dL; postprandial capillary blood glucose value=163.8±1.3 mg/dL), with glucose solution ingested by subjects; the mean capillary blood glucose concentration is higher than the mean venous blood glucose concentration by 35%; the correlation coefficient r=0.875(p<0.001) suggests statistical discrepancy and positive correlation between two groups of blood glucose concentration which imply the venous blood glucose concentration is a better indicator to clinically test blood glucose due to higher stability and fewer interference factors.
From 181 patients (non-fasting blood glucose) Exact Tech home blood glucose meter was used for either capillary or venous blood and to compare this with a reference whole blood glucose assay. Matthews et al., 2009 showed that not many differences were seen between capillary and venous blood glucose. Thus venous blood may be used even though the meter is calibrated for capillary samples, but the values must be corrected by dividing by 1:1.
According to Brad et al., 2007 there is no significant difference between median capillary whole blood and laboratory plasma glucose values in 20 patients receiving IV insulin in the 5 hours after cardiac surgery. The whole blood glucose level, measured on the Roche Accu-Chek inform glucometer, is appropriate for monitoring glucose levels in patients receiving IV insulin after cardiac surgery. The median arterial whole blood glucose level was significantly higher (14 mg/dL [0.8 mmol/L]) than the laboratory plasma glucose level, as was the median venous whole blood glucose value (12 mg/dL[0.7 mmol/L). Differences between arterial and venous whole blood and laboratory plasma glucose levels are increased as a function of glucose concentration.
According to Koenig, 2007 subject of 97 healthy volunteers were examined using a glucometer (Bayer Elite) designed for capillary samples. Means venous and capillary blood sugar measurements were 104.5 (+/- 20.7) mg/dL, mean age was 37, and 56 were male, respectively. All five patients with capillary glucose values lower than80 mg/dL had normal or elevated venous measurements. Conversely, one patient with a capillary value of 143 mg/dL had a venous measurement of only 58 mg/dL. The overall correlation between venous and capillary measurements was extremely poor (Pearson correlation coefficient, 0.24).
3.0 AIM AND OBJECTIVES
AIM: The present study aims to understand the difference between venous and capillary blood to determine glucose using Glucometer (Accu-Chek).
OBJECTIVES: To measure the concentration of glucose by using capillary blood samples. To identify the concentration of glucose by using venous blood samples. To understand and identify the changes in blood glucose by using venous and capillary blood samples.
4.0 MATERIALS AND METHODS
Sample collection: Samples were collected two times from the same individual. 1st sample: Capillary blood; 2nd sample: Intravenous blood. One drop of fresh blood each from capillary and venous blood is placed in the sample reasonably to estimate glucose by using Accu Chek glucometer. The result was observed within 5 seconds.
Place of collection: Samples were collected from Loyola Boys Hostel and Loyola College and from outside college. The work was done in Loyola Health Centre and MLT laboratory, Loyola College.
Patient selection: This prospective study used healthy, non-fasting volunteers. Each patient had venous and capillary blood samples taken at the same time.
The number of study cases: 100 samples were collected from healthy volunteers, which include 64 males and 36 females of the age group 17-31 years.
4.1 MATERIALS REQUIRED: Accu- Chek glucose kit, Syringe, Spirit, Cotton swab, Lancet, Eppendroff (EDTA) tube
4.2 METHOD: Electrochemical Method
4.2.1 Principle: The enzyme glucose dehydrogenase converts the glucose in a blood sample to gluconolactone. This reaction liberates two electrons that react with a coenzyme electron acceptor, the oxidised form of the mediator hexacyanoferrate (III), forming the reduced form of the mediator, hexacynoferrare (II). The test strips employ the electrochemical principle of biamperometry. The metre applies a voltage between two identical electrodes, causing the reduced mediator to be reconverted to an oxidised mediator during the incubation period. This generates a small current that the meter reads as blood glucose.
4.2.2 Specimen requirements: Capillary, venous, neonatal (including cord blood), and arterial whole blood specimens may be used for testing on the ACCU-CHEK® Inform Glucose Meter.
4.2.3 Procedure
4.2.3.1 Capillary blood (Finger puncture) Procedure: The patient ID was always verified by using a minimum of two identifiers. Blood glucose testing using Roche Accu-chek. The finger was massaged to increase blood flow (the finger is squeezed gently from hand to fingertip 5-6 times). The fingertip was cleansed with alcohol with 70% isopropyl alcohol and using cleaned gauze, and it was wiped dried or allowed to air dry (alcohol can incorrectly elevate blood glucose results). Using sterile lancet, a skin puncture was made off just off the centre of the finger pad. The first drop of blood was wiped away (which tends to contain excess tissue fluid), and intermittent pressure was gently applied to the surroundings tissue until the required blood volume was obtained. The side was not to be squeezed, or strong repetitive pressure was not applied to the site (this may result in haemolysis or increased tissue fluid in the blood). The second drop of blood was touched, and the curved edge of the yellow target area was held on the
Accu-Chek test strip. Fifteen seconds was time-limited to fill the test strip once the specimen had been added to the strip. No Yellow can be shown on the test strip.
4.2.3.2 Venous Blood (Venipuncture): Blood specimens are to be performed within 30 minutes of specimen collection to minimise the effect of glycolysis.
Procedure: The sample was collected in a Green top (heparin) or Lavender top (EDTA) Vacutainer tube. It was made sure that the tube was filled. The collection tube was mixed gently by inverting. Using syringe needle, the top of the Vacutainer was punctured, and a quantity of blood was withdrawn sufficiently to dose the testing strip. A drop of blood pushed out of the end of the syringe needle onto the curved edge of the yellow target area of the test strip. The target area was directly avoided touching with the needle.
4.2.4 Normal values: According to the manufacturer, the test is linear up to 600 mg/dL (33.3mmol/L). This method will accurately measure glucose levels down to 10 mg/dL (0.6mmol/L). The ACCU-CHEK® Inform Meter measurement range is 30-600mg/dL.
Non-Fasting Reference Range: Normal : 70-140 mg/dL
Fasting Reference Range: Normal : 70-110 mg/dL, Pre – diabetes : 100-125 mg/dL
5.0 RESULTS
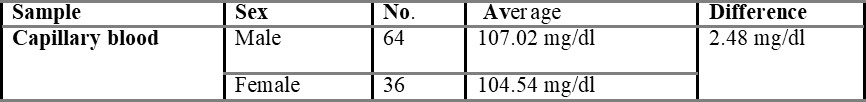
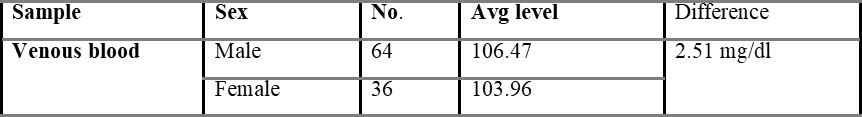
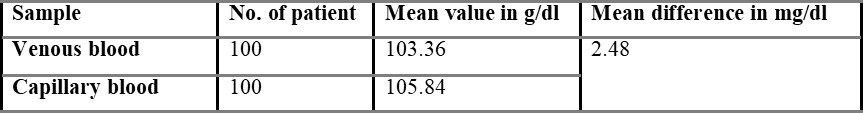
One hundred volunteers were enrolled in the present study. No individuals declined to participate in the study, and there was complete data capture. Out of 100 individuals, 64 were males, and 36 were females, and then the mean age of the subjects was 24.34 years (range 17-31 years). The overall mean capillary blood glucose was 105.48 g/dl, and overall mean venous derived glucometer blood glucose was 103.36 g/dl. There was a 2.48 g/dl difference between the capillary and venous derived glucometer tested samples.
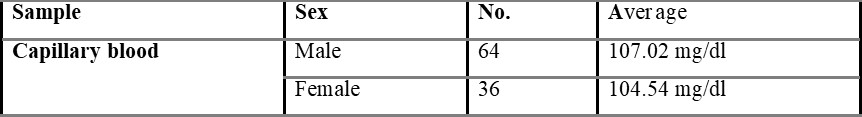
Overall average capillary blood glucose level was found to be 105.84, which is shown in table 5.1.
Table 5.1.1 shows capillary blood glucose levels between males and females with the average level of 107.02 and 104.54 mg/dL, respectively. The average overall venous blood glucose level was found to be 103.36 mg/dL and was shown in table 5.2. Table 5.2.1 represents venous blood glucose levels in males and females with an average value of 106.47 103.96 mg/dL, respectively.
Comparison of capillary and venous blood glucose based on sex is shown in table 5.3, with the mean difference value of 2.48 mg/dL. The mean difference between overall capillary and venous blood is found to be 2.54 mg/dL and is shown in table 5.4.
It was found that appreciable differences do occur between the venous glucometer and laboratory blood sugar levels despite a good correlation. Increased in error is probably due to the lower precision in the measurement of glucose in intestinal fluid (ISF) samples because of the procedure used for the small number of samples. The study shows that there is a slight difference between capillary and venous blood glucose.
6.0 DISCUSSION
The use of venous derived blood glucose estimation using glucometers designed for capillary blood samples enables rapid treatment decisions during the reception phase of emergency treatment. The procedure has the advantages of not requiring the capillary specimen, thereby minimising patient discomfort, decreasing the risks to staff from additional needle stick exposures, and reducing the risk of factitious hyperglycaemia from finger pulp glucose contamination (Mclnnes E et al., 1984).
In the present study, the difference between venous and capillary blood is very small i.e., 2.48 g/dl. So, venous blood can be used to estimate blood glucose by using glucometers designed for capillary blood samples in case of emergency to enable rapid treatment decisions.
However, it is important that the venous blood glucose measurement is accurate to avoid failure to treat underlying hypoglycaemia or placing the patient at risk for potential neurological complications from the administration of 50% dextrose for erroneous hypoglycaemia in the presence of cerebral ischaemia and cardiac arrest (Browning et al., 1990).
There is confusing evidence in the current literature about whether capillary or venous glucose measurements tested on blood glucometers are more accurate. In one study of healthy volunteers, Funk et al., 2001 concluded that there was a poor correlation between capillary and venous blood glucose estimations using glucometers designed for capillary samples. The study, however, did not use a laboratory blood glucose test or take into account the impact of acute sickness on blood sugar estimation. Two studies of critically ill patients found that the venous derived bedside glucose estimations were more accurate than capillary derived samples (Sylvian et al.,1995).
Glucometers are widely used for the determination of capillary glycaemia in emergency departments since they have the advantage of providing rapid and punctual information on the glycaemia of the patient. The good correlation between glycaemia measured in capillary and venous blood using the glucometer and the measurement in serum of plasma in the conventional laboratory (greater than 85-87%) is well known, although this varies depending on the glucose concentration and therefore a reduction may be observed in the precision in extreme concentrations (Marina et al., 2008).
A statistical difference did occur between the capillary and venous bedside blood glucose estimates, but such a difference (2.48 g/dl) may not be clinically significant in routine practice. This supports the view that venous derived bedside glucometer blood glucose measurements may be used in capillary derived specimens in the management of non-critically ill patients. However, a degree of caution should be exercised in the interpretation of bedside glucometer measurements as they may not be sufficiently accurate to replace laboratory blood glucose results Boyd et al., 2003. Because substantial outliers are not uncommon, a laboratory blood glucose measurement is recommended when the blood glucometer result is borderline or likely to dramatically modify clinical therapy. The vast majority of published data on metre performance is based on tests conducted in controlled situations.
The error contribution made by end users (i.e. patients and health care practitioners therefore need to remain vigilant about the possibility of meter error. Undertaking occasional comparisons between simultaneous laboratory and finger prick samples measured on the patient’s own meter system and undertaking regular reviews of meter technique remain important tools for minimising errors (Helen et al., 2010).
The aim of the present study was to test the accuracy of venous derived blood glucometer results using glucometers designed for capillary samples in the broad spectrum of non-critical illness that represents the majority of emergency department patients. In the present study, 100 patients (64 males + 36 females) of healthy volunteers were enrolled. The difference between venous and capillary blood glucose is very little, so it cannot be said that capillary or venous blood is more accurate. A significant difference did occur between the capillary and venous blood glucose estimates, but such a difference (2.48 g/dl) may not be clinically significant in routine practice.


6.1.1 Limitation: In the present study, fasting and prandial blood glucose levels were not measured; only random blood glucose was studied. The study included only healthy volunteers and not a diabetic patients. There is no limited age group.
7.0 CONCLUSION
The present study reveals that there is a small difference in the blood glucose result analysed by using a glucometer when samples are obtained from capillary and venous blood. There is a good correlation between venous and capillary whole blood samples; caution must be exercised in accepting the result as equivalent or using either as a substitute for laboratory blood glucose results. The capillary blood glucose is higher because the glucose level in the capillary is not fully developed in the cell. Once the blood leaves the capillary and enters the vein, the glucose will be delivered to the cell. The difference between venous and capillary blood glucose measurement is relatively poor in this group of healthy volunteers. Further research may be conducted on patients at risk for abnormal blood glucose.
REFERENCES
- Wallace AJ, Willis JA, Monro JA, Frampton CM, Hedderley DI, Scott RS. No difference between venous and capillary blood sampling and the minimed continuous glucose monitoring system for determining the glucose response to food. Nutrition Research. 2006; 26(8): 403-408. https://doi.org/10.1016/j.nutres.2006.07.007.
- Expert Committee on the Diagnosis and Clasification of Diabetes Mellitus. American Diabetes Association: clinical practice recommendations 2002. Diabetes Care. 2002 Jan;25 Suppl 1:S1-147. https://doi.org/10.2337/diacare.25.2007.s1. PMID: 11788484.
- Carstensen B, Lindström J, Sundvall J, Borch-Johnsen K, Tuomilehto J; DPS Study Group. Measurement of blood glucose: comparison between different types of specimens. Ann Clin Biochem. 2008 Mar;45(Pt 2):140-8. https://doi.org/10.1258/acb.2007.006212. PMID: 18325176.
- Karon BS, Gandhi GY, Nuttall GA, Bryant SC, Schaff HV, McMahon MM, Santrach PJ. Accuracy of roche accu-chek inform whole blood capillary, arterial, and venous glucose values in patients receiving intensive intravenous insulin therapy after cardiac surgery. Am J Clin Pathol. 2007 Jun;127(6):919-26. https://doi.org/10.1309/6RFQCKAAJGKWB8M4. PMID: 17509989.
- Boyd R, Leigh B, Stuart P. Capillary versus venous bedside blood glucose estimations. Emerg Med J. 2005 Mar;22(3):177-9. https://doi.org/10.1136/emj.2003.011619. PMID: 15735263; PMCID: PMC1726696.
- Lopez J. Carl A. Burtis, Edward R. Ashwood and David E. Bruns (eds): Tietz Textbook of Clinical Chemistry and Molecular Diagnosis (5th edition): Elsevier, St. Louis, USA, 2012, 2238 pp, 909 illustrations. ISBN: 978-1-4160-6164-9. Indian J Clin Biochem. 2013 Jan;28(1):104–5. https://doi.org/10.1007/s12291-012-0287-7. Epub 2012 Dec 13. PMCID: PMC3547451.
- Centers for Disease Control and Prevention. National Diabetes Fact Sheet, 2011. Atlanta, GA: Centers for Disease Control and Prevention, US Department of Health and Human Services. 2011.
- Chiaohsin Yang, Chiawei Chang, Jenshinn Li. A Comparison between Venous and Finger-prick Blood Sampling on Values of Blood Glucose, International Conference on Nutrition and Food Sciences IPCBEE, 2012, IACSIT Press, Singapore. 2012; 206-210.
- Clarke WL, Cox D, Gonder-Frederick LA, Carter W, Pohl SL. Evaluating clinical accuracy of systems for self-monitoring of blood glucose. Diabetes Care. 1987 Sep-Oct;10(5):622-8. https://doi.org/10.2337/diacare.10.5.622. PMID: 3677983.
- Colagiuri S, Sandbaek A, Carstensen B, Christensen J, Glumer C, Lauritzen T, Borch-Johnsen K. Comparability of venous and capillary glucose measurements in blood. Diabet Med. 2003 Nov;20(11):953-6. https://doi.org/10.1046/j.1464-5491.2003.01048.x. PMID: 14632723.
- Dai KS, Tai DY, Ho P, Chen CC, Peng WC, Chen ST, Hsu CC, Liu YP, Hsieh HC, Yang CC, Tsai MC, Mao SJ. Accuracy of the EasyTouch blood glucose self-monitoring system: a study of 516 cases. Clin Chim Acta. 2004 Nov;349(1-2):135-41. https://doi.org/10.1016/j.cccn.2004.06.010. PMID: 15469866.
- Cengiz E, Tamborlane WV. A tale of two compartments: interstitial versus blood glucose monitoring. Diabetes Technol Ther. 2009 Jun;11 Suppl 1(Suppl 1):S11-6. https://doi.org/10.1089/dia.2009.0002. PMID: 19469670; PMCID: PMC2903977.
- Eriksson KF, Fex G, Trell E. Capillary-Venous differences in blood glucose values during the oral glucose tolerance test. Clin Chem. 1983; 993-998.
- Funk DL, Chan L, Lutz N, Verdile VP. Comparison of capillary and venous glucose measurements in healthy volunteers. Prehosp Emerg Care. 2001 Jul-Sep;5(3):275-7. https://doi.org/10.1080/10903120190939788. PMID: 11446542.
- Gabir MM, Hanson RL, Dabelea D, Imperatore G, Roumain J, Bennett PH, Knowler WC. Plasma glucose and prediction of microvascular disease and mortality: evaluation of 1997 American Diabetes Association and 1999 World Health Organization criteria for diagnosis of diabetes. Diabetes Care. 2000 Aug;23(8):1113-8. https://doi.org/10.2337/diacare.23.8.1113. PMID: 10937507.
- Geiss L, Engelgau M, Pogach L, Acton K, Fleming B, Roman S, Han L, Wang J, Vinicor F. A national progress report on diabetes: successes and challenges. Diabetes Technol Ther. 2005 Feb;7(1):198-203. https://doi.org/10.1089/dia.2005.7.198. PMID: 15738716.
- Kanji S, Buffie J, Hutton B, Bunting PS, Singh A, McDonald K, Fergusson D, McIntyre LA, Hebert PC. Reliability of point-of-care testing for glucose measurement in critically ill adults. Crit Care Med. 2005 Dec;33(12):2778-85. https://doi.org/10.1097/01.ccm.0000189939.10881.60. PMID: 16352960.
- El Khoury M, Yousuf F, Martin V, Cohen RM. Pseudohypoglycemia: a cause for unreliable finger-stick glucose measurements. Endocr Pract. 2008 Apr;14(3):337-9. PMID: 18463040.
- Kempe K, Price D, Ellison J, Marhoul J, Morrow L, Win K, Kuschma K, Hompesch M. Capillary and venous blood glucose concentrations measured during intravenous insulin and glucose infusion: a comparison of steady and dynamic states. Diabetes Technol Ther. 2009 Oct;11(10):669-74. https://doi.org/10.1089/dia.2009.0023. PMID: 19821760.
- Rasaiah B. Self-monitoring of the blood glucose level: potential sources of inaccuracy. Can Med Assoc J. 1985 Jun 15;132(12):1357-61. PMID: 4005724; PMCID: PMC1346098.
- Roche Diagnostics. Accu-Chek Comfort Curve. Indianpolis, IN: Roche Diagnostics. 2004.
- Sacks DB, Arnold M, Bakris GL, Bruns DE, Horvath AR, Kirkman MS, Lernmark A, Metzger BE, Nathan DM; National Academy of Clinical Biochemistry; Evidence-Based Laboratory Medicine Committee of the American Association for Clinical Chemistry. Guidelines and recommendations for laboratory analysis in the diagnosis and management of diabetes mellitus. Diabetes Care. 2011 Jun;34(6):e61-99. https://doi.org/10.2337/dc11-9998. PMID: 21617108; PMCID: PMC3114322.
- Sandbaek A, Lauritzen T, Borch-Johnsen K, Mai K, Christiansen JS. The comparison of venous plasma glucose and whole blood capillary glucose in diagnoses of Type 2 diabetes: a population-based screening study. Diabet Med. 2005 Sep;22(9):1173-7. https://doi.org/10.1111/j.1464-5491.2005.01491.x. PMID: 16108845.
- Somogyi M. Studies of arteriovenous differences in blood sugar; effect of alimentary hyperglycemia on the rate of extrahepatic glucose assimilation. J Biol Chem. 1948 May;174(1):189-200. PMID: 18914074.
- Suresh N. Thennadil, Jessica L. Rennert, Brian J. Wenzel, Kevin H. Hazen, Timothy L. Ruchti, and Marshall B. Block. Comparison of Glucose Concentration in Interstitial Fluid, and Capillary and Venous Blood During Rapid Changes in Blood Glucose Levels. Diabetes Technology & Therapeutics. 2001 Sep; 357-365. http://doi.org/10.1089/15209150152607132
- Sylvian HF, Pokorny ME, English SM. Accuracy of finger prick glucose values in shock patients. Amer J Cril Care. 1995; 44-48.
- Boyd R, Leigh B, Stuart P. Capillary versus venous bedside blood glucose estimations. Emerg Med J. 2005 Mar;22(3):177-9. http://doi.org/10.1136/emj.2003.011619. PMID: 15735263; PMCID: PMC1726696.
- World Health Organisation, Laboratory Diagnosis and Monitoring of Diabetes Mellitus. 2002. https://apps.who.int/iris/handle/10665/42642
- Zimmet P, Alberti KG, Shaw J. Global and societal implications of the diabetes epidemic. Nature. 2001 Dec 13;414(6865):782-7. http://doi.org/10.1038/414782a. PMID: 11742409
ARTICLE TYPE: Research Article;
ORCID ID: Open Researcher and Contributor Identifier (ORCID) ID of corresponding author: https://orcid.org/0000-0002-4061-2840;
ETHICAL: Institutional Ethics Committee;
ACKNOWLEDGEMENT: None;
FINANCIAL DISCLOSURE: The authors declare that there was no financial aid received.;
CONFLICT OF INTEREST: No conflict of interest associated with this review work.;
AUTHORS CONTRIBUTION: Conceptualization: G.P., Methodology: V.K., Investigation: P.S., Result Analysis and Writing: V.M.,;
CORRESPONDING AUTHOR AFFILIATIONS: Mr. Vyshnav Manikandan. Masters in Human Clinical Embryology and Assisted Conception, University of Dundee, Nethergate, Dundee DD1 4HN, Scotland.;
CORRESPONDING AUTHOR EMAIL: 2472888@dundee.ac.uk;
ARTICLE CITATION: Priya G, Krishnan V, Sree P, Manikandan V. Comparative study on venous and capillary blood collection for estimation of glucose. SALT J Sci Res Healthc. 2021 September 28; 1(2): 13-23.
PUBLISHER’S NOTE: All claims expressed in this article are solely those of the authors and do not necessarily represent those of their affiliated organizations, or those of the publisher, the editors and the reviewers. Any product that may be evaluated in this article, or claim that may be made by its manufacturer, is not guaranteed or endorsed by the publisher.


© Geetha Priya, Vishakha K, Pooja S and Vyshnav Manikandan.
Originally published in the SALT Journal of Scientific Research in Healthcare (https://saltjsrh.in/), 28.09.2021.
This is an open-access article distributed under the terms of the Creative Commons License (https://creativecommons.org/licenses/by-nc-nd/4.0/), which permits unrestricted use, distribution, and reproduction in any medium, provided the original work, first published in the SALT Journal of Scientific Research in Healthcare (https://saltjsrh.in/), is properly cited. The complete bibliographic information, a link to the original publication on https://saltjsrh.in/, as well as this copyright and license information must be included.